
There are many measures of the volatility of an investment asset, and none are completely satisfactory. And that leaves aside the fact that volatility in itself, as the second moment of a distribution is not necessarily the best way of capturing the variations in a distribution with heavy tails.
However, measuring volatility is necessary for many reasons, including to determine the allocations in a volatility control, or risk parity strategy.
How should we measure volatility ?
The basic definition of volatility that we all learn very early on is the standard deviation of the daily (log) changes of a price index. The usual convention is to “annualise” this number by multiplying by the square root of the number of business days in a year (usually taken to be 252). But can we do better than this without introducing too many extra complications ?
This definition implicitly weights each piece of information (ie, each day’s price change) equally in determining the volatility estimator. Its clear this is not intuitive, we know that a price change taking place a year ago should be less influential on our estimate of market volatility today than one yesterday, and further that our estimator of today’s volatility should not change just because a large price change a year ago rolls out of our measurement window. These two issues motivate the use of an exponentially weighted measure.
Although this can sound and appear intimidating, its actually very intuitive. It simply tells us that each day we take our previous estimate of volatility and update it for today’s information (today’s price change). So our new estimator is now a weighted average of yesterday’s estimator and today’s price change. The weightings applied to these two parts of the estimator must add up to 1. A fast reacting estimator might for example give today’s information a 5% weighting, and 95% weighting to the previous estimator. A slow moving estimator might weight today’s information by 0.1%.
Although some of the mathematics when laid out in full can seem complex, this approach more closely approximates the behaviour of the human brain in adjusting an old estimator for new information.
In the chart below we show how these two estimators gave differing estimates for the realised volatility of the MSCI World index over 2012.

The black line is an exponentially weighting estimator with a half life of around 50 days – that means half of the “information” being taken into account in the estimator is coming from the last 50 days. The blue line represents an equally weighted estimator of the last 100 days, chosen so that it also has the feature that half of its “information” comes from the last 100 days.
There are a few interesting observations of the difference between the two, which help us to understand their relative characteristics and behaviour:
- The exponential estimator can increase quickly, but decreased gradually (visually giving a “sawtooth” appearance. This is because large moves get gradually weighted lower in the estimator, rather than suddenly falling out of the estimate window
- The equally weighted estimator decreases quickly (from higher level) in the early part of the year as some of the large moves in August and September 2011 drop out of the estimator. By contrast, the exponentially weighted estimator still has some weight on these observations (albeit decreasing).
- The exponential estimator jumps up more quickly in response to a single large market move: to be expected as the weight placed on the most recent day in the exponential estimator is 1.5x that placed on the most recent day in the equally weighted estimator
- The two estimators give a slightly different impression as to what happened to realised volatility over the year. The exponential measure suggests it was on a downtrend for almost all of the year, with a couple of little spikes up in May. The equally weighted estimator shows a move downward to lower levels followed by a cyclical upswing which peaked in June/July
- The reality of what happened in the market over the course of the year is probably closer to that suggested by the exponentially weighted estimator as opposed to the equally weighted one.
Going further, I show below the equally weighted and exponentially weighted volatility measures back to January 2000 :
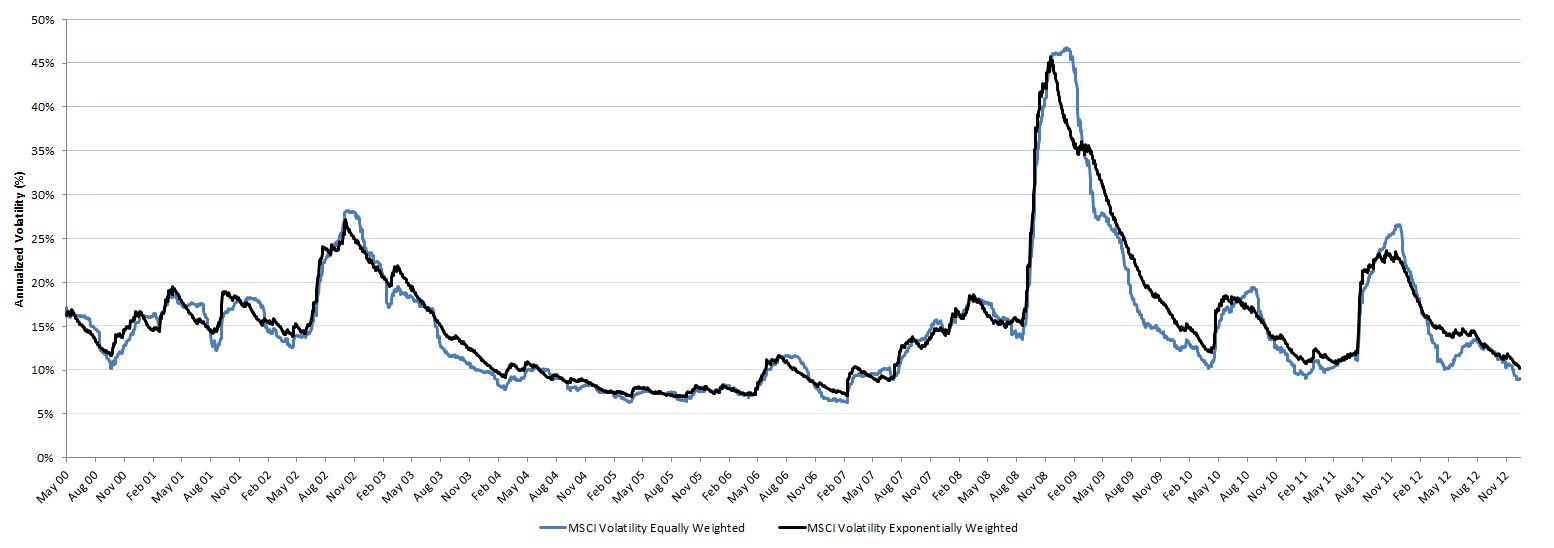
This illustrates many of the same points, in particular I would highlight that while both measures clearly show the same broad increases and decreases in volatility at a more detailed level they do disagree on the timing of the high points in volatility. The equally weighted measure tells us that the peak of volatility in the MSCI World was in April 2009, whereas the exponentially weighted measure peaks in October 2008. As a participant in the markets over this period of time I can say with a reasonable degree of certainty that the latter more closely represents reality. The equally weighted measure peaks later as all the large moves remain within the window for some time afterwards. It decreases quite sharply as these observations begin to roll out of the 100 day window in April 2009, this also is not consistent with intuition: in reality volatility ebbs away slowly in the absence of further shocks in the manner shown by the exponentially weighted measure.
One thought on “Volatility Control : a story of two measures of volatility”