
Volatility control is an approach to portfolio management that deploys capital according to risk, as measured by volatility. Click here for an introduction to the approach or here for some frequently asked questions on volatility control.
Volatility control has a positive effect on risk-adjusted investment performance, this is because increases in volatility are usually associated with equity market falls and in these situations the volatility control approach will de-gear or reduce exposure to equities during these times, preserving capital.
We have done a comprehensive analysis of the risk adjusted performance of volatility control historically, across a number of equity markets. We illustrate the results in terms of sharpe ratio, which is the ratio of the excess return (over an appropriate cash rate) to the volatility of the returns. To put it into context, if equities return 4%p.a. in excess of the cash rate, at a volatility of 20%p.a. this equates to a sharpe ratio of 0.2.
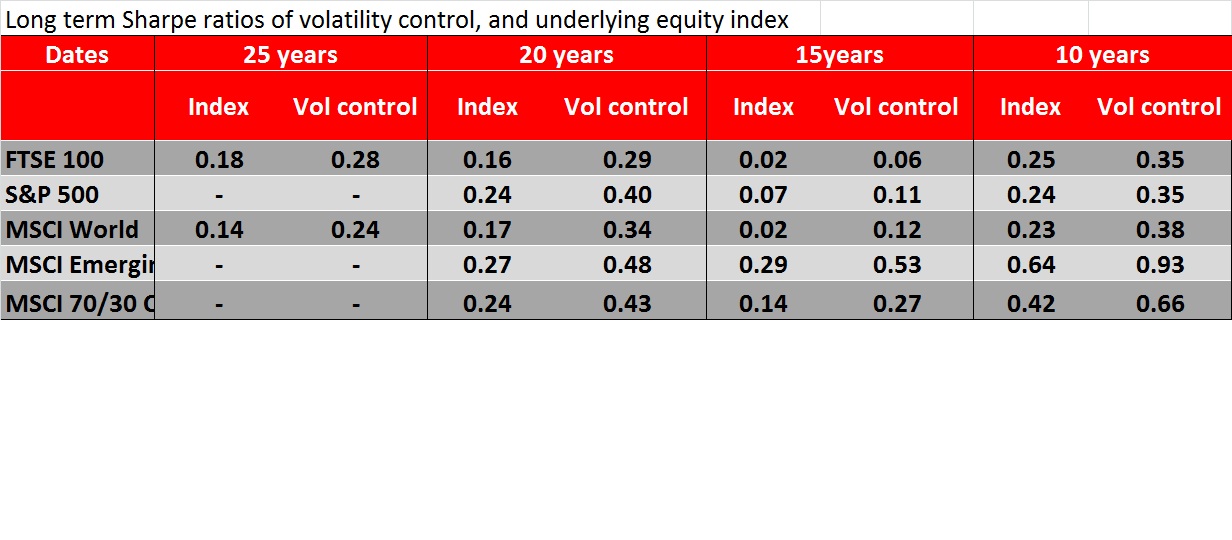
The table below illustrates the sharpe ratios of a volatility controlled approach to investing in a number of different markets, as compared to the sharpe ratio of the underlying index.
Observations
- Under all periods tested and markets the volatility controlled approach shows a higher Sharpe ratio than the underlying index
- Over the longer time periods the sharpe ratio pick-up of volatility control averages around 0.1-0.15
- To put this into context, a fixed allocation to equity has had a historical volatility of around 20%p.a. and a return over the risk free rate of around 4%p.a. this equates to a sharpe ratio of 0.2 (=4%/20%)
- Applying a volatility control approach could be expected to increase the sharpe ratio to 0.3. This would mean that for a 10% volatility level, we could expect a 3%p.a. return in excess of the risk free rate. Or for a 12% volatility level we could expect a return above the risk free rate of 4%
- In other words, given the risk adjusted return improvement a volatility controlled approach can be expected to deliver similar returns to a fixed market allocation, at a lower level of volatility
- It is important to note at this point (and see the FAQ section in the appendix) that we are not suggesting volatility control is a “free lunch”, in any given year it can and has delivered lower returns than a fixed allocation – 2012 being an example and the approach will cut out the spectacular positive years that fixed allocations to equities do have.
- Our quantitative results are supported by a study by Guido Geese published in the Journal of Indexes in October 2012 which also concludes:
“Regarding target volatility indexes, we have shown that their long-run Sharpe ratio is always better than the Sharpe ratio of the underlying equity index as long as the target volatility level is chosen within reasonable boundaries”
The details of the volatility control approach used was as follows
• Volatility target of 10% (although the risk adjusted return is independent of the level targeted).
• The volatility measure was an exponentially weighted measure with a 50 day half life (better than an equally weighted measure as it does not drop suddenly due to single observations dropping out of a window, click here for more information on this measure).
• The volatility was measured daily
• There as a limit placed on the maximum and minimum sizes of rebalancing trade that could occur on any given day: the maximum was 5% and the minimum was 1%
• There was a maximum exposure limit of 150% placed on the equity exposure in all cases. However this was never reached
• Transaction costs were not taken into account in either the volatility control approach or the underlying index
• For a strategy implemented through futures, we estimate that futures roll costs of a passive index tracking investment would be 12 bps per annum
• We estimate the additional transaction costs associated with the volatility control strategy would be 3 bps per annum